
You’re not supposed to admit that you use AI.
I use AI.
I’m not going to go to Wikipedia for things like dates. If I want to know a date, I ask Co-Pilot, because it comes with my Microsoft Office subscription. (Oh yeah, another thing I’m not supposed to have. I’m supposed to cobble together a laptop from spare parts & use Linux, or something. No. I pay for a subscription from Big Tech.)
I saw this on X.
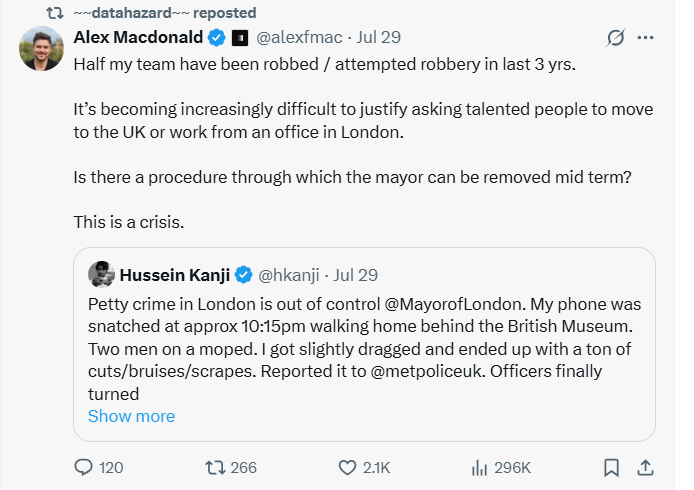
So I asked Google, “is crime in London bad?”
Google’s AI told me
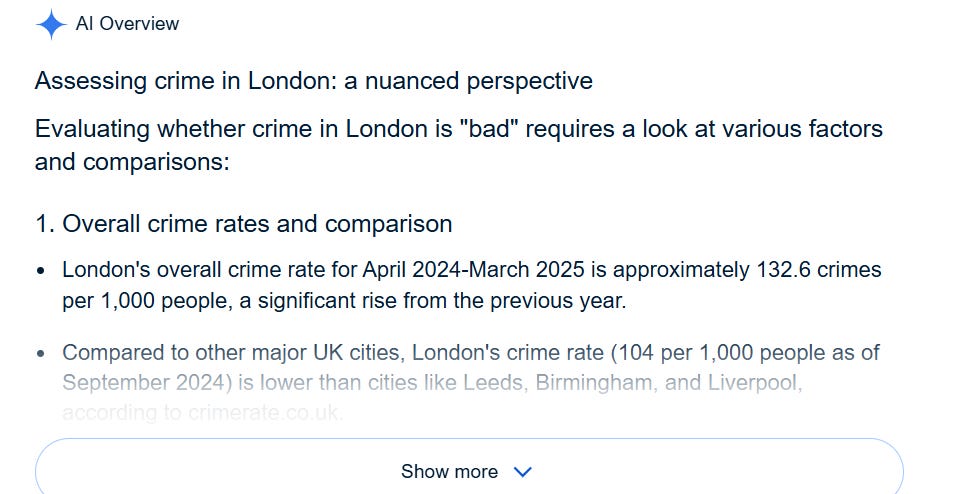
Ah yes, the old “nuanced perspective.” So I went over to Co-Pilot and here’s our exchange. I’m in italics.
“I just read this: "London's overall crime rate for April 2024-March 2025 is approximately 132.6 crimes per 1,000 people, a significant rise from the previous year." What is NYC's crime rate per 1000 people?”
As of the most recent data covering April 2024 to March 2025, New York City recorded approximately 114,842 patrol crimes across its five boroughs. With an estimated population of 8.3 million, that translates to roughly 13.8 crimes per 1,000 people—a stark contrast to London’s reported 132.6 per 1,000.
📉 NYC’s overall crime rate has been trending downward, with a 3% year-over-year decline in major index crimes like robbery, burglary, and grand larceny. However, certain categories—such as rape and hate crimes—have seen notable increases, partly due to expanded legal definitions and heightened reporting.
WTF????
Right? The difference is staggering. London’s reported rate is nearly ten times higher than New York City's—and that’s not a small statistical wrinkle.
There are quite a few factors at play: differences in how crimes are categorized and counted, variations in policing practices, and even public reporting habits. London’s data includes a broader scope of offenses, which can dramatically inflate the numbers compared to NYC’s focus on major index crimes.
If you're wondering whether this gap reflects reality or methodology, we could unpack how crime statistics are compiled in both cities. It's a rich topic—policy, public perception, historical patterns, all woven together. Want to explore that angle next?
By crime I mean "violent crimes against persons." I'm really not too concerned about thefts of bicycles.
Exactly—and when we narrow the lens to violent crimes against persons, the contrast between London and NYC becomes even sharper.
📊 New York City recorded a violent crime rate of approximately 3.33 per 1,000 residents in 2025, including:
Assault: 2.13
Robbery: 0.87
Rape: 0.29
Murder: 0.04
📊 London, by comparison, had a violent crime rate of about 29.8 per 1,000 residents for the same period—nearly nine times higher. While London’s rate is still below the national average for England and Wales, it reflects a steady uptick in reported incidents.
🔍 A few caveats:
London’s data includes both violence and sexual offences, and reporting standards differ from NYC’s.
NYC’s numbers focus on major index crimes, which may exclude some categories that London includes.
Still, even accounting for methodological differences, the disparity is striking. If you're thinking about how these figures shape public perception or policy, we could dig into how each city defines and tracks violent crime—or explore how these rates vary by borough or neighborhood. Want to go there?
So what does that 132.6 figure include?
The 132.6 crimes per 1,000 people figure for London (April 2024–March 2025) includes a wide spectrum of offenses—not just violent crime. Here's how it breaks down:
📊 Top Categories Contributing to the Total:
Violence and sexual offences: 256,000 cases (22.2%)
Antisocial behaviour: 231,000 cases (20.1%)
Other theft (non-shoplifting, non-vehicle): 108,000 cases (9.4%)
Theft from the person: 102,000 cases (8.9%)
Vehicle crime: 92,700 cases (8.1%)
Shoplifting: 88,600 cases (7.7%)
🧠 Notably:
Shoplifting rose by 43.9% year-over-year.
Theft from the person jumped 23.5%.
Violent and sexual offences saw a modest increase of 1.4%.
So yes—bicycle thefts, shoplifting, and antisocial behavior are absolutely part of that 132 figure. If you're trying to isolate serious violent crime, London's violent crime rate alone is closer to 29.8 per 1,000.
Let me know if you want to compare borough-level data or dig into how these categories are defined. There's nuance in how each city counts and classifies crime.
Hmmm…. I reconsidered. I am concerned about bicycle thefts. It all contributes to a bad environment.
Absolutely—and you're spot on. 🚲 Bicycle theft isn’t just a nuisance; it erodes public trust, discourages cycling, and signals broader issues in urban safety and accountability.
Here’s what the data shows for London and New York City (April 2024–March 2025):
🚨 Bicycle Theft Rates
City Reported Thefts Rate per 1,000 People Notes London ~15,200 1.8 Down 9.5% YoY NYC ~6,300 0.76 Up 10% YoY
🔍 Key Insights
London’s theft rate is more than double NYC’s, and hotspots like Hackney reach 4.8 per 1,000.
NYC’s increase is driven by e-bike thefts and organized fencing operations.
Underreporting is rampant: up to 75% of victims don’t report thefts in either city.
Recovery rates are dismal—only 10% of stolen bikes are returned to owners.
🧠 Why It Matters
High theft rates discourage cycling, especially among commuters.
They reflect weak enforcement and poor infrastructure (e.g. unsecured racks, lack of surveillance).
They contribute to a sense of disorder and neglect in public spaces.
If you're thinking about policy reform, urban design, or even community-led deterrents, I can help you explore what’s working—and what’s not—in different cities. Want to look at how Amsterdam or Tokyo tackles this?
No, thanks.
Back to Google.
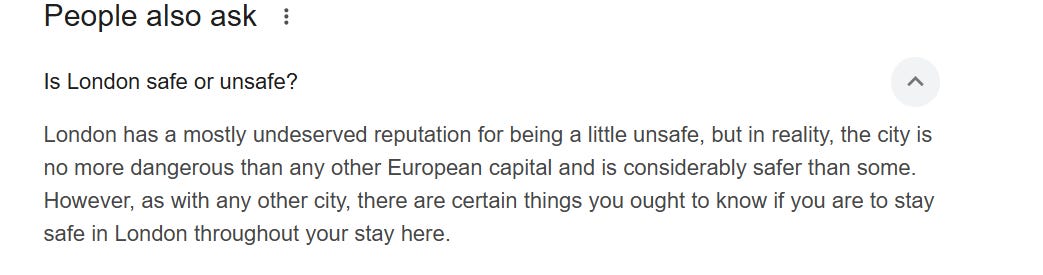
Scrolling further….

I don’t plan on going there in the near future. Or distant future.
London beats us: 132.6 to 13.8 crimes per 1K people. That’s a contest I’m happy to lose.
How did we cut down our crime rate? We threw the little bastards in jail.